Thursday, October 7, 2010

Servo Motor Controller

 The servo motor is widely used in model hobbyist such as airplane R/C model for moving the rudder, ailerons, elevators and acceleration control or in the car R/C model for steering and acceleration control. In this tutorial we will learn how to control the servo motor as well as the simple close loop control algorithm for this servo motor.
Since the internal control electronics of each servo motor expects to have position data updates at intervals of approximately 60 times per-second (60Hz), the timeout/label helps establish this timing without using additional pause commands or other methods. Notice from the scope trace below that we have 15mS delays between the servo pulses. This corresponds to our 15mS delay time waiting for incoming serial data in the serial-input code line.
 
Pulse Position Modulation
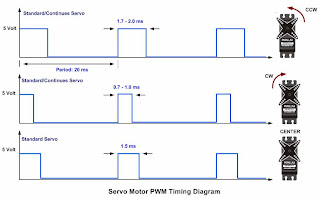
The most important thing to remember from this servo tutorial is that all standard servos use the Pulse Position Modulation (PPM) language. A pulse is simply whether or not the control voltage is on or off. The amount of time that a pulse is on during a 2ms time frame dictates the servos position. This time frame, or sequence, repeats around 50 times per second. During the first half of this 2ms time frame, the pulse is always on. This starts a counter, so to speak, to tell the servo to start listening for the command. The second portion of this 2ms time frame is the command that dictates the position of the servo.
Take a look at the chart below to help you better understand this servo tutorial. The amount of time during the designated 2ms time frame that the pulse will be on for the three most extreme positions(far left, far right, neutral). There are an infinite amount of positions in between these values and amount of time the pulse is ON changes in proportion. This is what makes Pulse Position Modulation analogue.
Servo #1:
Far Left Command: Time ON = 1 + 0.0 ms = 1.0 ms
Servo #2:
Neutral Command: Time ON = 1 + 0.5 ms = 1.5 ms
Servo #3:
Far Right Command: Time ON = 1 + 1.0 ms= 2.0 ms

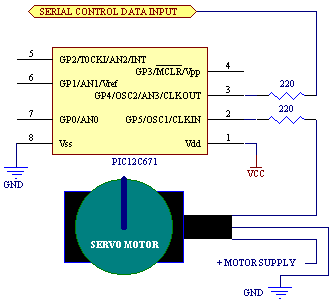
The pulsout command uses the positional data received/stored in the byte-variable pos to generate the servo control pulses. The PIC12C671 is limited to a maximum oscillator speed of 4MHz, hence, the period of the generated pulses will be in 10uS increments.Now that we have the servo-pod ready to use, we need to figure out how to send positional data to the servo-pod that will let us position the servo motor. As stated previously -- we know that the pulsout command is dependent on the oscillator frequency, and the pulse duration will be in 10uS increments when used in conjunction with an oscillator frequency of 4MHz. Since the PIC12C671 maximum operating frequency is 4MHz, we'll have to make due with this resolution. The circuit diagram is given below:

The Test Program:
Now that you're ready to start using the servo-pods, some test code to cycle the servo motors will be necessary. Here's a quick & simple Basic Stamp routine that will cycle a servo motor attached to a servo-pod hard-coded with the unique ID #5.
Stepper Motor Controller

Stepper motors, unlike ordinary DC motors, are brushless and can divide a full 360° into a large number of steps, for example 200. In robotics, stepper motors are widely used. They offer amazing precision as well as continuous rotation. Also, any inaccuracy between steps are non-cumulative; 200 steps will always be 1 revolution. These features make them ideal for driving the wheels on a robot, and creating linear motion using a leadscrew. The drawbacks are that they require current when not moving they are relatively expensive and they are quite heavy for the amount of torque they give. 
 
 By using an external stepper motor controller, such as the UCN 5804, you can simplify your programs and control as many motors as you have outputs via an array of UCN 5804's. Not only does it allow for the control of more motors, but more importantly, it simplifies the process. You now only have to output the pulse of your desired speed. Additionaly, you can switch between full and half stepping in real time via a switch on the UCN 5804 (or you may have the PIC control it), as well as reverse direction. A pinout for the UCN804 is shown in below:
The PIC Basic language has a command that allows you to read the value of potentiometers on a given scale. This is the "pot" command, and is used in the following manner:

pot pin,scale,var
Where pin is the pin the potentiometer is connected to (pins B0-7), scale is the maximum value the command will return (in this case 245, being the maximum amount of ms we want in between pulses), and var is the variable the value will be placed in. Using this command, we can determine the value of a potentiometer (we will be using a 50K ohm pot) and then use it to control the pulsewidth outputted to the UCN 5804. A schematic is shown in below:

The Code in given below
' Controlling a stepper motor with the UCN 5804 and a potentiometer
Symbol delay = B0                   ' make a delay variable
low 1                                        ' set the output enable low

start:
pot 2,245,delay                        ' read pot at pin B2
if delay < 25 min                       ' set min delay to 25
goto turn

turn:                                        ' if delay is over 25, start moving
delay = delay * 1000                ' turn delay into microseconds
pulsout 0,delay                         ' send to UCN 5804
goto start                                  ' go back to start

min:
delay = 25                                ' bottom out the delay at 25
goto turn                                   ' start the motor


Wednesday, October 6, 2010

Object Replacing With Line Follow Robot


This given video representing Object Replacing With Line Follow Robot. This robot has many complex features and application. These in a robotic hand which used for replacing the object.
[I can not give the Source Code and Hex File.]

Tuesday, October 5, 2010

Line Follow Robot


The above photos are representing my hand made first “Line Follow Robot”. This robot can follow simultaneously white line or black line. It also can work in 90 degree angle type line, small circle, end of line etc.


Testing the robot
  I created courses for the robot to follow out of black and white electrical insulation tape, using one colour per course. For each course I initially balanced the robot's left and right sensors and adjusted the brightness of the headlight LEDs.
One of the tests was to determine the ability of the robot to sense lines under various conditions. For this, I measured the voltage at each of the robot's sensor test points after placing it directly over the top of a straight line in a course, with it's motors switched off. I repeated the test with the robot pointing slightly to the right and then to the left of the line.
The measurements were taken with a box covering the robot to shield it from all ambient light and then with the box removed so that I could measure the impact of the room's lighting. 

Low cost multfunctional frequency counter


We are introducing a low cost multifunctional seven digit LCD frequency counter, for your HAM radio shack. This frequency counter is designed in such a way that it can be used for direct frequency measurement or with any of the commercial / home made radio/transceiver as a digital frequency display. The power consumption of the counter is very low. It could be operated with even an ordinary 9V battery for a long period. This frequency counter contains only a few components. The brain of the unit is a PIC 16F84 micro-controller. The LCD display used is a state of the art, commonly available 16 characters dot matrix in one line unit. The other main attractive feature is the use of a single transistor as the input amplifier, which will give a sensitivity of less than 150 m.V with a very high bandwidth. With this, the counter is useful for the measurement of a wide variety of input wave forms without loosing the accuracy. The counter is capable of measuring frequency up to 35MHz in normal condition and is suitable up to 3.5GHz with pre-scalar.

MAIN FEATURES
  • 10 Hz frequency resolution.
  • Direct frequency measurement.
  • Seven offset channels selectable with a push button.
  • Each offset channel got 3 options (VFO + IF) , (VFO IF), ( IF - VFO ) selectable with a three position switch. 
  1. Eg.1 Suppose IF is 9MHz (9MHz SSB filter using with home made TRX) and VFO is 2 MHz you have to select the third option (IF-VFO) ie (9 2) = 7 for 40 mtr operation. 
  2. Eg.2 Suppose IF is 9MHz and VFO is 5MHz you have to select the first option VFO+IF ie 9 + 5 = 14 for 20 mtr operation With this offset channel selection option you can simply input the VFO frequency to the counter with out any conventional mixing for displaying the operating frequency.
  • In each of the above offset channel option, it is possible to select USB/LSB displayed as N / R (Normal / Reverse) selectable with another 2 position slide switch.
Download Hex File

Light Detection


This experiment detects the presence of light. A photo-darlington transistor is connected to the circuit via a plug and socket and exposed to light. The change in resistance of the photo-darlington transistor creates a voltage change across it and this is amplified by the circuit and delivered to an input of the microcontroller. The program turns on the 8 LEDs when the photo-darlington transistor detects change in illumination. The photo-darlington transistor is connected to the circuit via a capacitor and only CHANGES in illumination are detected.
If the illumination is decreased, a point will be obtained where the circuit is sensitive to the changes in supply rail voltage. At this point the circuit will start to oscillate or MOTOR-BOAT. The circuit must be re-designed to prevent this from occurring. If the photo-darlington transistor is placed in a room with incandescent lighting, the 50 or 60Hz from the light will be detected. These pulses must be dealt with by the program to obtain a reliable HIGH/LOW pulse.

Measuring Resistance


This experiment measures resistance. You can get very low-cost digital multimeters to measure resistance and display the value on a four digit display. We cannot compare with cost and complexity of this type of display, but our circuit has other features. It will activate a device when a particular value of resistance is detected. This allows measurement of degrees of rotation of a potentiometer or the conductivity of a liquid (via two probes), plus many other areas where resistance values change. Our demonstration program uses a potentiometer to detect resistance in the range 0k to 10k however any other range can be read, by changing the value of C. The accuracy of the circuit is determined by the tolerance of C (most capacitors are 10%). The time taken to produce a low on the input is used as a jump value in a look-up table and a display-value is obtained for the 7-segment display. For simplicity, the values 0 to 9, plus "-" overflow, are displayed. Further experiments show two and three-digit accuracy.

Download SourceCode

Pulse Detection with a coil


This experiment uses a coil to detect pulses. A magnet is moved past a coil and this creates a voltage in the turns of the coil. This is ideal for picking up the rotation of a shaft. It is non-mechanical and will have an infinite life. Reed switches have a very short life when used rapidly to detect shaft rotation and have a fairly low speed of operation. The output voltage of a coil is fairly low and needs two stages of amplification for the signal to be large enough to be detected by the input of a microcontroller. The clever arrangement on the front end of the analogue amplifier of the PIC LAB-1 board allows a microphone or coil to be fitted. The coil does not require the resistor, (it is required by the electret microphone) however it does not affect the operation. This demonstration program increments the 7-segment display.
This allows a count-of-ten however experiments on the web include a 2 and 3-digit readout from the 7-segment display and an RPM counter. The advantage of a magnetic pickup is the lack of switch-noise. The pulses from the pick-up are very clean but must be debounced for low-speed detection. The 2-stage amplifier increases the sinewave signal and over-amplifies it to produce a rail-to-rail signal commonly called a square-wave or digital signal.

Download Source Code

Analog to Digital Conversion Using PIC16F84

This experiment shows 0-256 parts of a 10k potentiometer on the 8 LEDs. It is not accurate, but shows the concept of A to D conversion. Many microcontrollers have an input that can read any value of voltage from 0v to 5v (and higher by using a voltage divider network). Normally there are 256 steps in this range to produce a resolution of approx 20mV for 0-5v scale. This is called an A to D input (A to D converter - analogue input) and is ideal for measuring voltages and other values that are classified as ANALOGUE. A very simple external circuit can be added to measure different parameters such as the change in resistance of a temperature probe and other analogue devices. The PIC16F84 does not have an internal A to D converter, however we can create an A to D feature by using two lines and a sub-routine. To create an analogue input, a capacitor "C" is connected in series with an unknown resistor (R) and charged via one of the lines of the microcontroller. The diagram below shows how this is done.
 
 
The first diagram shows a resistor and capacitor connected in series. This is called a TIME DELAY circuit. The capacitor is initially uncharged and the resistor charges the capacitor to a specified value. The time taken to reach this value is called the Time Delay. The mid-point of the two components is called the "detection point." It does not matter if the resistor is above the capacitor or below. The same Delay Time (or a similar time) will be produced.
In the second diagram the capacitor is above the resistor and if the top line is taken HIGH, the voltage at the detection point will fall to a specified value after a Delay Time. If the value of the resistor is changed, the time taken for the voltage at the detection point to reach a specified value will alter. That's exactly what happens in the third circuit above. The micro monitors the voltage on the detection point and when it reaches the lower threshold for the input line, the program displays the "count-value" on the 8 LEDs.
The other feature that has to be worked out is the time taken for the capacitor to charge. In our circuit, the capacitor has charged before 255 loops have been executed (when the pot is at maximum resistance) and we cannot same at a faster rate, so the maximum display-value is "DF." To obtain a full reading, the capacitor will need to be increased in value.
 

Hee Haw Sound

This experiment creates a Hee Haw sound for an alarm. The diagram shows the number of cycles for the HEE and the time taken for each cycle, equates to a certain length of time. The frequency of the HAW is lower and the number of cycles must be worked out so that the time for the HAW is equal to the time for the HEE. This is simple when writing the program. The values loaded into the two files for the HEE are reversed for the HAW. The routine consists of two sections: HEE and HAW. Each section has two nested loops. The inner loop creates the length of time for the HIGH and LOW to produce a single cycle and the outer loop creates the number of cycles.

Download Source Code

Saturday, October 2, 2010

Moving Message Display


It is possible to process periodically with the hardware timer. While the hardware timer is counting time, the software can do the other processing. In the software, the scroll of the message is periodically done by the interruption processing of hardware timer. And the lighting-up control processing of LEDs is executed in the waiting time of scroll. The Circuit diagram of this project is given below.
  •  LED control circuit
  • As for the left figure, all RA ports are in the L level condition. In this case, only outout-0 of 74HC154 is L level. Then, only TR1 is in the ON condition, the other transistors are in the OFF condition. So, only the LEDs which are connected with TR1 are in the lighting-up possible condition. The lighting-up of the LED is decided in the condition of the RB7-RB0 ports. In case of the left figure, because RB0 and RB4 are L level, D1 and D5(It isn't displayed in figure) light up. The other LEDs are connected with RB0 and RB4 can't be lit up, because the transistors for the power supply to those LEDs are in the OFF condition.


    The figure on the left shows the situation of the LED blink by the RA ports and the RB ports of PIC16F84A. You can find that the lighting-up time of one LED is 1/16 with this animation. If using latch registers for each LED row, the lighting-up time of the LEDs can be made long. I don't use latch registers because the printed board space needs more.
    Download Source code
    Download Hex File


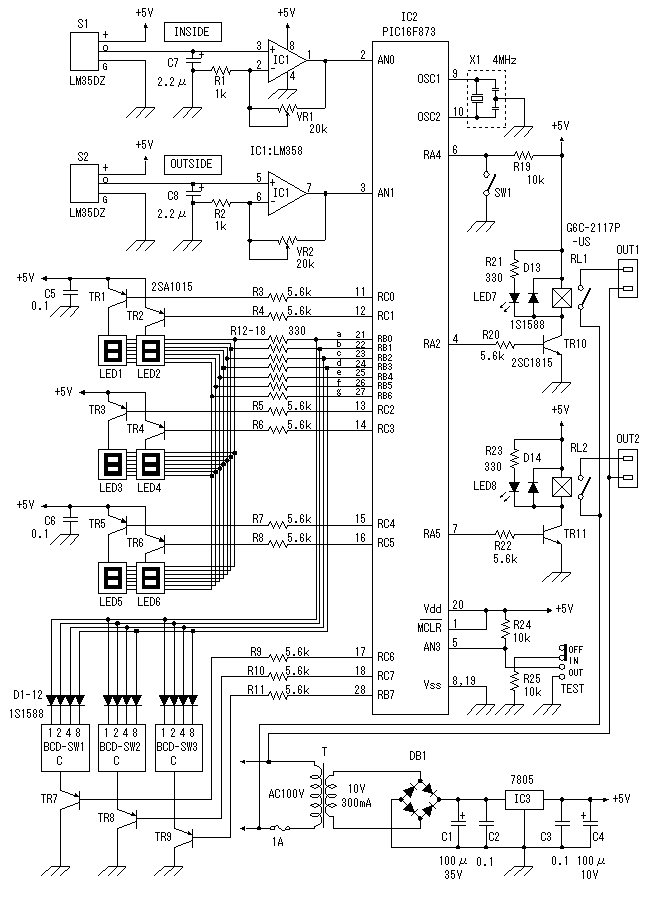
Room temperature controller


This equipment uses two temperature sensors, drives external equipment, and keeps the temperature of the room at preset temperature. The purpose of this equipment is for preventing room temperature going up with the heat of the computers. Electric cost will become high if an air-conditioner is always operated. Then, I made the equipment which adjusts the temperature of the room automatically using some ventilation fans. The function below preset temperature is a function attached moreover. I think that it can use for temperature control, such as a greenhouse. Control mode(works over preset or below preset) is changed with a switch.
  •  LED display and SW reading circuit

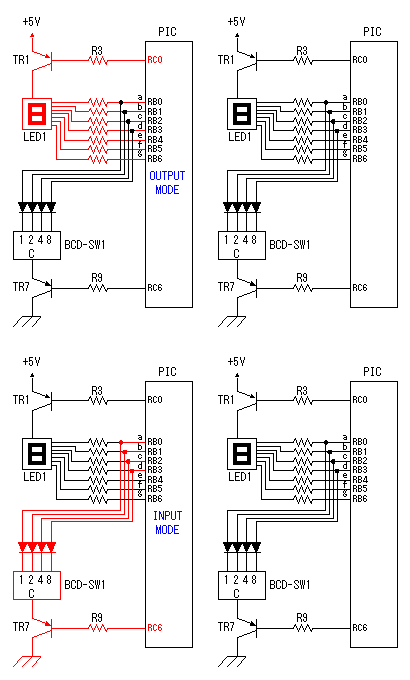
7 bits of low ranks of PORTB are used for lighting of 7 segment LED, and reading of BCD switch in common. PORTC and the 8th bit of PORTB is used for designation of a device. The mode change of PORTB is required of LED control and BCD-SW control. This change is performed by software.
The diode connected to the BCD switch is for prevention of illegal current. With a BCD switch, a common terminal and each terminal corresponding to a bit short-circuit by setup. If there is no diode, the setting state of a switch will influence operation of other devices. In the case of a silicone diode, VF is about 0.6V. When L level detection of the PIC cannot be normally carried out with this voltage, it is better to change a diode into other kinds.(Germanium etc.)


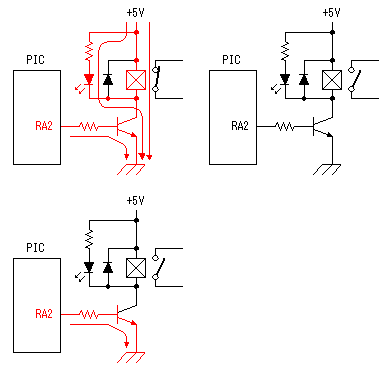
  • External equipment drive circuit 
 
This is the circuit which controls external equipment. Although based on the drive current of the relay to be used, in this case, the drive circuit which uses a transistor is adopted.


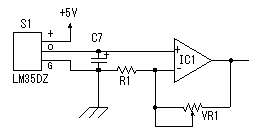
  • Temperature sensor circuit
 A temperature sensor (LM35DZ) can measure from 0°C to 100°C. However, the output is 0V at 2°C. Therefore, the voltage of minus is required in order to measure 0°C. Since the minus power supply is not used with this equipment, the measurable temperature is above 2°C. The output of a sensor goes up by 10mV for every 0°C. The output voltage in 32°C is 300mV. The output voltage of a sensor is amplified by an operational amplifier, and is inputted into the A/D converter of PIC. Proofreading of a temperature display is performed by adjusting the gain of an operational amplifier by VR. In this circuit, in order to simplify a circuit, the operational amplifier which operates with a plus single power supply is used.


Friday, October 1, 2010

RF Remote Controller (Receiver)


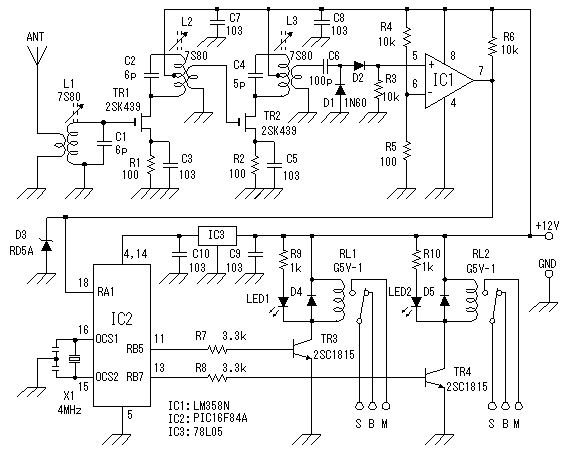
The given circuit diagram representing the receiver section of previous RF Remote Controller.

FET amplification circuit is used for a high frequency amplification circuit of the receiver. It is because the getting of parts is easy. So, it doesn't have high sensitivity. To make the receiver with high sensitivity, the circuit which used IC for FM receiver is good.
  •  High frequency amplification circuit

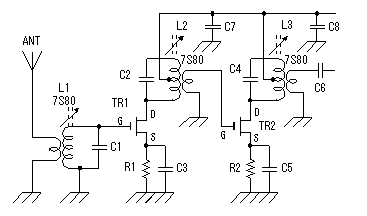
The 2 stages FET amplifier is used for the high frequency amplification. The FET amplifies only at the voltage to apply to gate (G). The resistor to be putting in the source (S) of the FET is to make the bias voltage of the gate. When making a resistance value big, voltage of the source goes up to the grounding and the bias voltage becomes big. In case of the gain of the amplifier is big, when the signal of the output returns to the input, an amplifier oscillates. In the case, it makes this resistance value big and the gain must be lowered. The power of the FET connects with the center tap of the coil (L2 and L3) to be putting in the side of drain (D). This is to make do operation to have been stable, improving the characteristic of the resonance circuit. The characteristic of the resonance circuit is called queue (Q). The ideal resonance circuit picks up only a resonant frequency. However, the actual resonance circuit becomes a shape like the mountain which made a resonant frequency a top. When the Q of the resonance circuit is high, the voltage at the resonant frequency becomes high and the resonant characteristic becomes good.
  • Detection circuit
Rectifying the output of the high-frequency amplifier directly with Germanium diode and it makes the DC voltage from high frequency voltage. This circuit can get twice voltage compared with usual rectification circuit. Because the charging takes time when the value of the capacitor (C6) to use for input is big, the change of the output voltage becomes late. I decided a value of this capacitor by the cut & try.
  • Relay drive circuit

RB5 and RB7 port of PIC make do the operation of the relays. It is converting the output voltage of PIC with the transistor. It makes LED light up to find the operation of the relay. It puts a resistor in the LED in series and it is limiting the electric current which flows through the LED to about 10 mA.
It is putting a diode in parallel with the relay. When the drive electric current of the relay passes away, the back electromotive force occurs to the coil of the relay. A transistor is prevented from the high voltage by passing the electric current of the back electromotive force to this diode. Because the relay to be using this time is small, there are few gravities that the transistor breaks even if it doesn't put a diode. I put it for the safety.
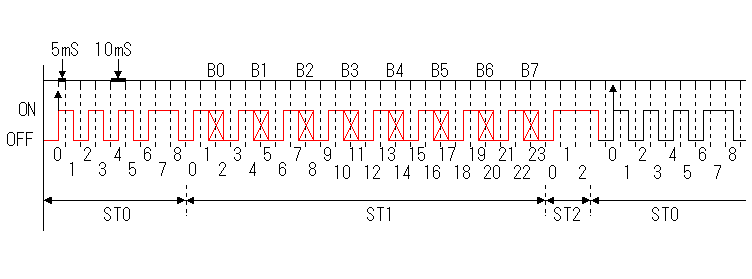
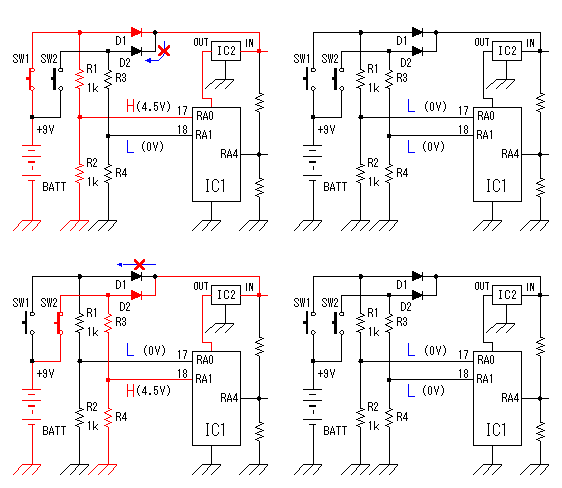
  • Time Chart for Receiver

 First, the receiver confirms that the electric wave exists. A 5-millisecond timer is set when an electric wave is received and the input signal becomes ON. The signal which is sent from the transmitter is a 10-millisecond interval. To detect ON/OFF in the position of the stable state, it is shifting for 5 milliseconds  from the standing-up of the signal.


RF Remote Controller (Transmitter)


The control code does the electric wave of the transmitter to the control of ON/OFF. At design first, I examin the adoption of the frequency modulation (FM) method by the control code. However, I adopted an electric wave ON/OFF method because the circuit was simple.
A control code is controlled by the software of PIC. With this, the control code can be easily changed. There are two purposes in this control code. The 1st is to secure security. The FM electric wave which was modulated at the single frequency can be made with the other equipment, being easy. At the circuit this time, a control code with byte(8bits) is used. To recognize a control code, to detect a specific signal in front of it is needed. Also, it makes not recognize a normally control code when not detecting a normally signal more than one time. The 2nd is to change the kind of the control. The kind to control are designated by the contents of the byte. At the circuit this time, only two kinds of codes are used. More kinds can be controlled if changing the input circuit of the control.
  • Power switch and control code selection circuit


The operation of the circuit of the transmitter only when pushing a control switch. When a control switch isn't pushed, it makes all circuits stop. When a control switch isn't pushed, it makes all circuits stop to suppress the consumption of the battery cell. The control switch combines the selector switch of the control code and the power switch. A control switch is connected with the side of the positive of the cell and a power is supplied to the circuit even if it pushes any switch. Control code selection malfunction is prevented by the diodes.
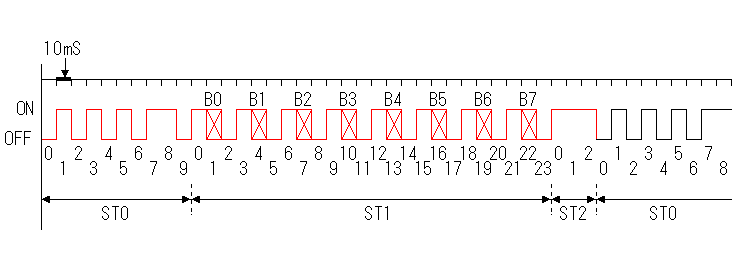
  •  Time Chart for Transmitter
I will show the time chart of the control code in the figure above. This composition is the composition which I contrived and is not standard composition. The switching time of each bit is 10 milliseconds. The signal to transmit from the transmitter is composed of three blocks. In the program, three blocks are managed by transmission status (TX_STATUS). ST0, ST1, ST2 show transmission status with the figure above. A bit in each block is managed by sub status (TX_SUBSTATUS). The figure which is written under the signal in the figure above shows sub status.

Stepper Motor controller

On this page, I will explain about the operation principle of stepper motor. There are many kind of stepper motors. Unipolar type, Bipolar type, Single-phase type, Multi-phase type... Single-phase stepper motor is often used for quartz watch. On this page, I will explain the operation principle of the 2-phase unipolar PM type stepper motor.In the PM type stepper motor, a permanent magnet is used for rotor and coils are put on stator. The stepper motor model which has 4-poles is shown in the figure on the left. In case of this motor, step angle of the rotor is 90 degrees.